Remote monitoring · Cloud
Remote compressor monitoring
See your fleets anywhere, anytime with internet, on a PC or phone. Less travel time and cost to each plant.
Many plants, one place to look
Plants are often far from the office, in another province, hours or half a day away. When a machine faults or service is coming due, you see it on screen before anyone has to travel.
Organised by organisation, plant, workshop, controller and each device. Roles for admin, technicians and office staff, and view-only accounts for selected fleets.
What you can see
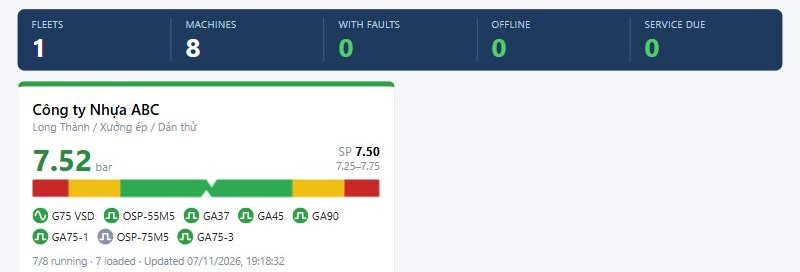
The big picture
All fleets on one screen: pressure of each fleet, which machines are running, which are stopped. A green machine is running, grey is stopped; a red name is a trip, an orange name is a warning.
Screenshot from the demo fleet.
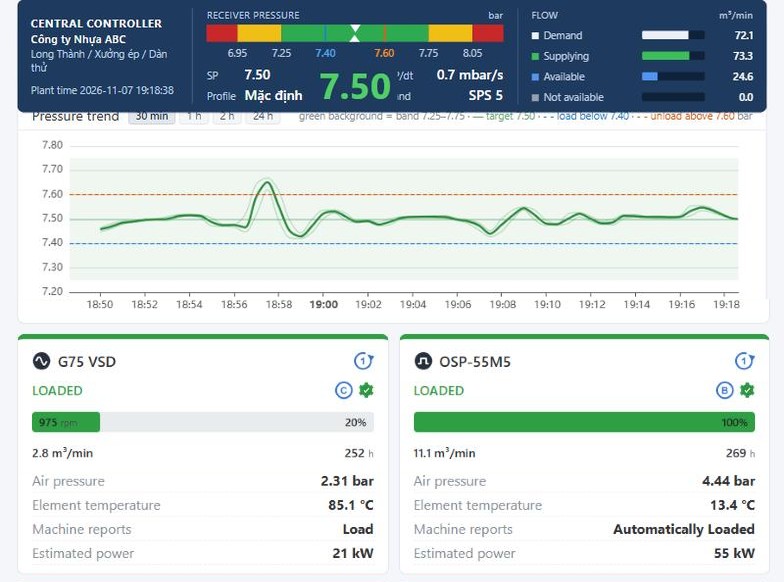
Each fleet
Pressure, air demand, pressure trend and machine cards. Pressure updates live while someone is watching. Look back over 30 minutes, 1, 2 or 24 hours.
Same interface as the Central Controller web. Screenshot from the demo fleet.
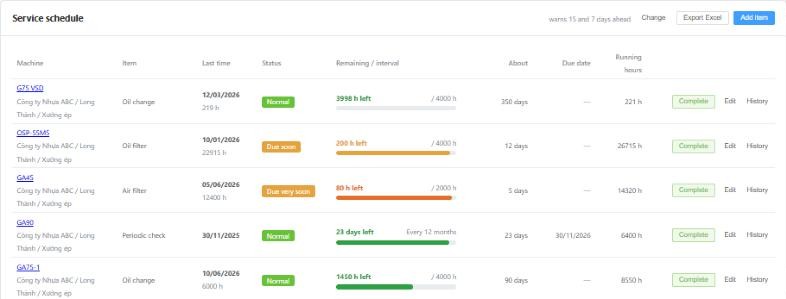
Running hours and service schedule
Set your own items by running hours or months, whichever comes first. Countdown from the machine's real running hours, press Complete when done, on-time or late statistics, Excel export.
Less work photographing hours on the panel and sending them to the office.
Real interface, sample data.
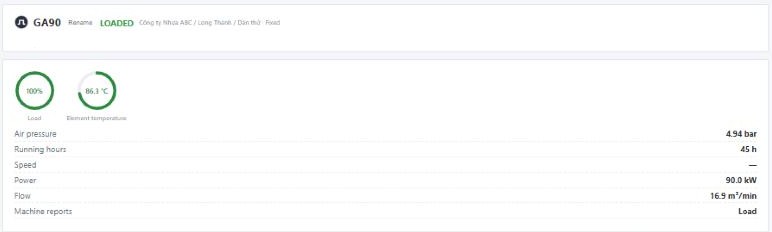
Each machine in detail
Click a machine to see load, element temperature, air pressure, running hours, power, flow and the state it reports.
Pressure and temperature history over 24 hours, 7 days, 30 days or chosen dates.
Screenshot from the demo fleet.
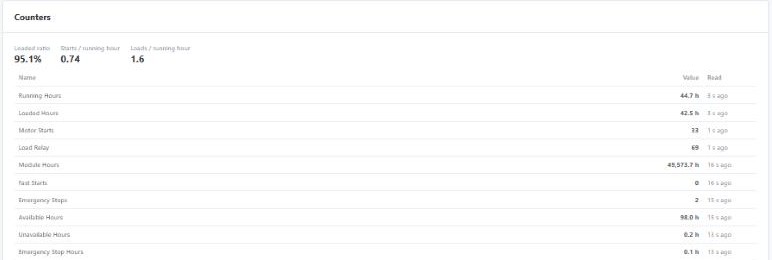
Machine counters and sensors
Running hours, loaded hours, starts, emergency stops, loaded ratio and starts per running hour. Read sensors, warnings and the settings on the machine's controller without going on site.
Screenshot from the demo fleet.
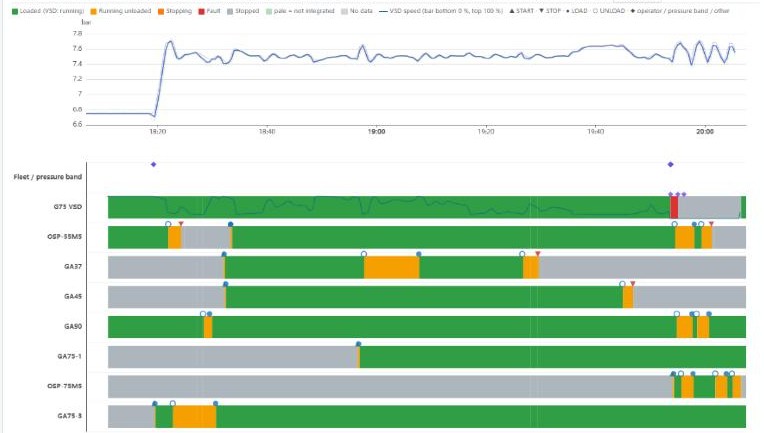
Fleet reports
Pressure and each machine's state on one time axis: loaded, unloaded, stopped, faulted, and when it started. Plus daily figures and an event log.
Up to 3 months per view, with CSV export for Excel.
Screenshot from the demo fleet.
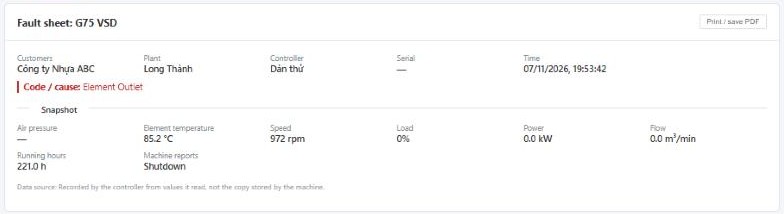
Automatic fault sheets
A machine trip creates a sheet: which machine, where, when, the cause, and the values the controller read at that moment. Share the link, or print and save as PDF.
Less work photographing every number on the panel when a machine faults.
Screenshot from the demo fleet.
Built for the whole team
Organised as a tree
Organisation, plant, workshop, controller, each device. Filter quickly to find the machine you need.
Roles
Admin, technician, office; technicians see only the plants assigned to them. Create view-only accounts for selected fleets.
PC and phone
The interface adapts to the screen, with tables turning into easy-to-read cards on a phone.
Excel export
Running hours, service schedule and completed work export to Excel for the office or customers.
Remote viewing, hands off control
One-way data
The cloud only receives data. It sends no start, stop or setting changes.
Network down, no problem
Data is sent when the network returns. Control at the plant does not depend on the internet.
Expiry only stops viewing
When the cloud service expires, only remote viewing stops. The controller at the plant keeps running.
What you need
The cloud is an add-on and receives data from a controller installed at the plant, so you need one of these:
Central Controller
Controls the whole fleet: keeps pressure in a narrow band, runs just enough machines, balances running hours.
Monitor edition
Reads data only and does not put machines under central control. A good fit if you are not ready to change how you control them. When needed, move up to Central Controller just by changing the license, on the same hardware.
Want to see your fleet remotely?
Tell us how many plants and machines you have and which brands.
Phone: +84 903 07 11 00 · Email: hao.nguyen@cdtnova.com.vn
Central Controller is an independent product of Nova Mechatronics. Screenshots are from the demo fleet on our test bench; the company name in them is an example, and the service schedule uses sample data.